dstat - Analyzing Linux System Performance
Knowing the effect of your application on the system and observing system performance while your application is going thru different scenarios can give you great insight about the bottlenecks and performance ceilings in your application. Today, lets look at some of the tools on Linux that will help us understand the system performance.
dstat is a tool that shows various system performance parameters in real time.
Install dstat on your Fedora system with "yum install -y dstat" or on your Debian based system with "apt-get install dstat"
Here's a screenshot of it working. Click on it to see the full image.
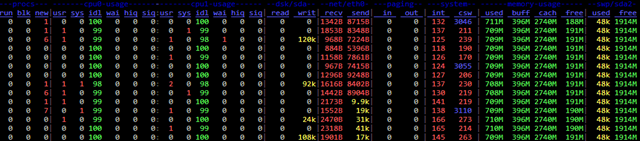
Here, you can see various useful information that can tell you if system performance is throttled due to one or more of the resources being maxed out or if there is scope to improve performance by balancing the usage of the under-utilized resources.
For example, on this specific system, you can see its resources are hardly utilized. It has capacity to handle to many times it's current load. Currently, there is barely some disk activity (maybe logging) and some network activity. Interrupts and context-switches are within decent range. Most of the memory is used by kernel for caching and hardly any swap usage.
Interesting column to watch is the first 3 columns under procs. It tells us the status of the current scheduler queue. We can see new processes are being spawned. If the system is suffering from too many processes being spawned and competing for CPU, these columns can indicate that. If we see too many processes in wait state and we see high disk or network I/O, it should indicate that the system is I/O bound. Also, memory column gives us the correct split of the memory actually in use v/s the memory used by kernel for caching and buffers.